Exam Code: LookML Developer
Exam Name: LookML Developer
Certification Provider: Google
Corresponding Certification: LookML Developer
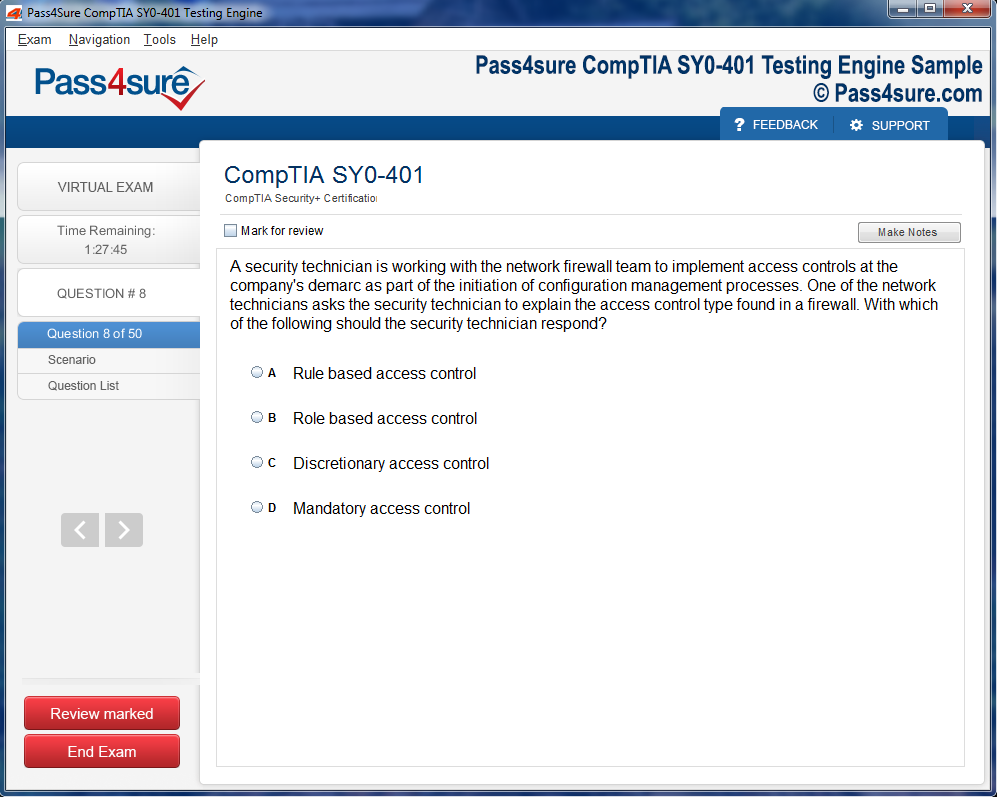
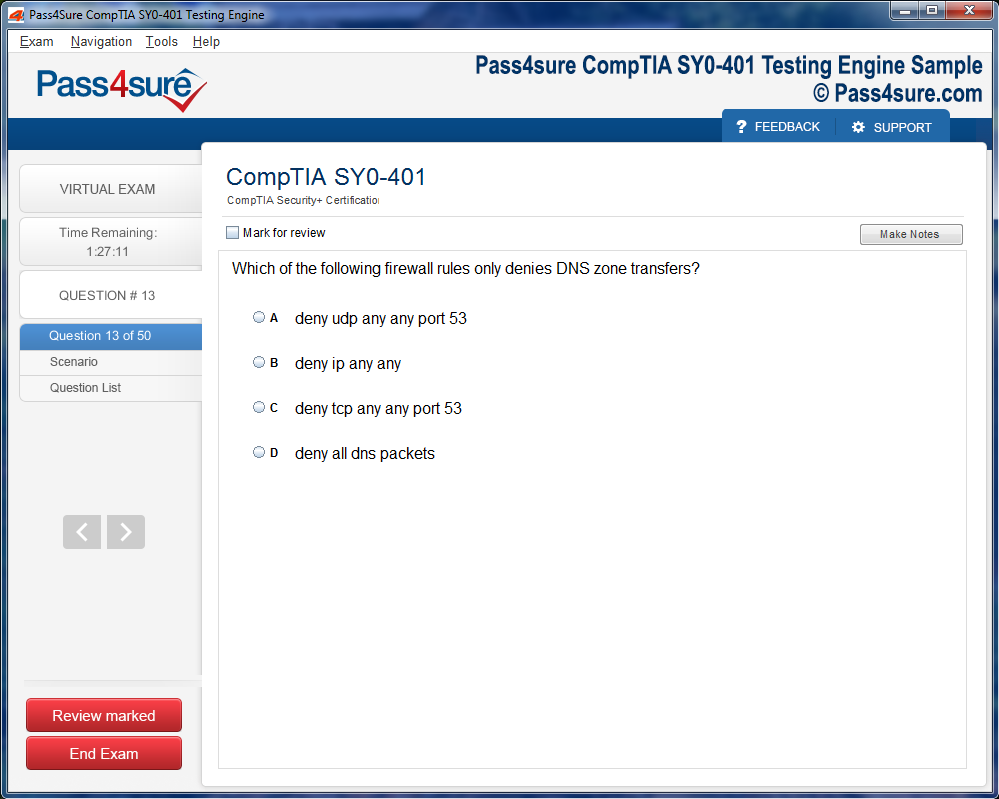
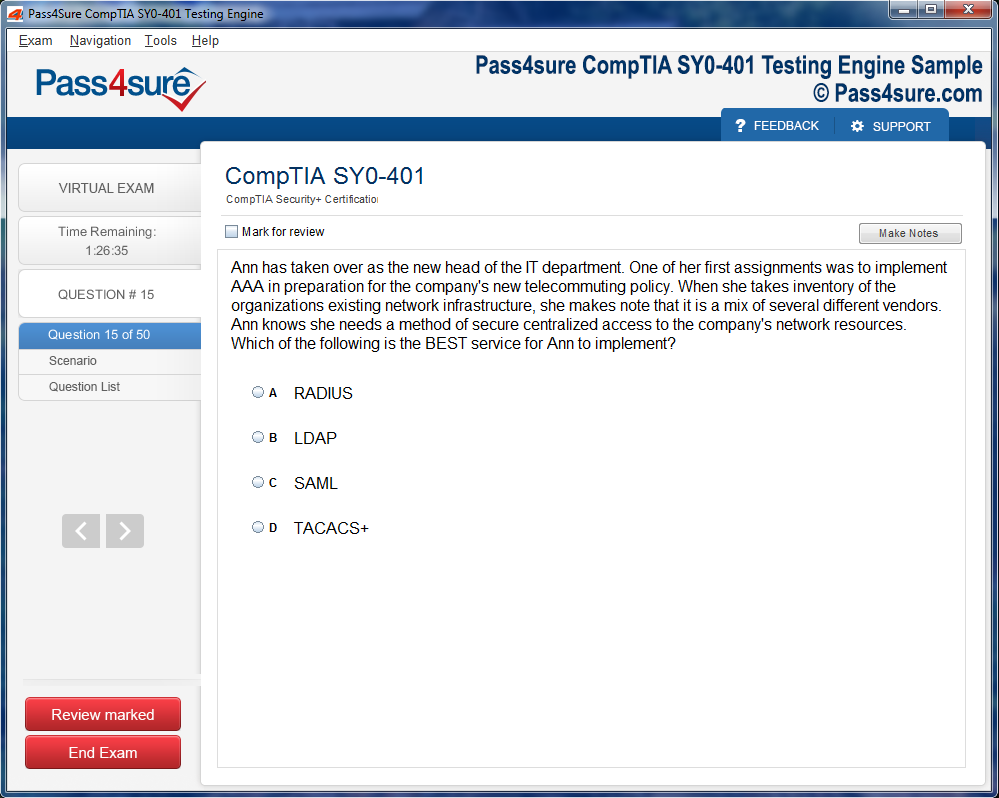
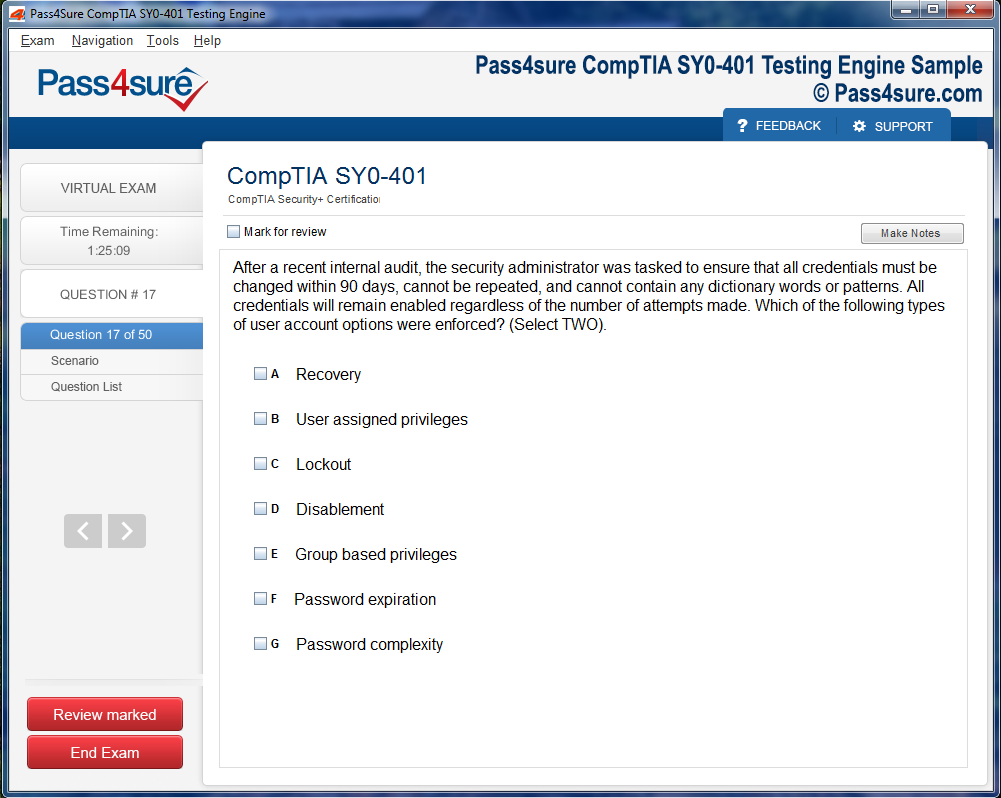
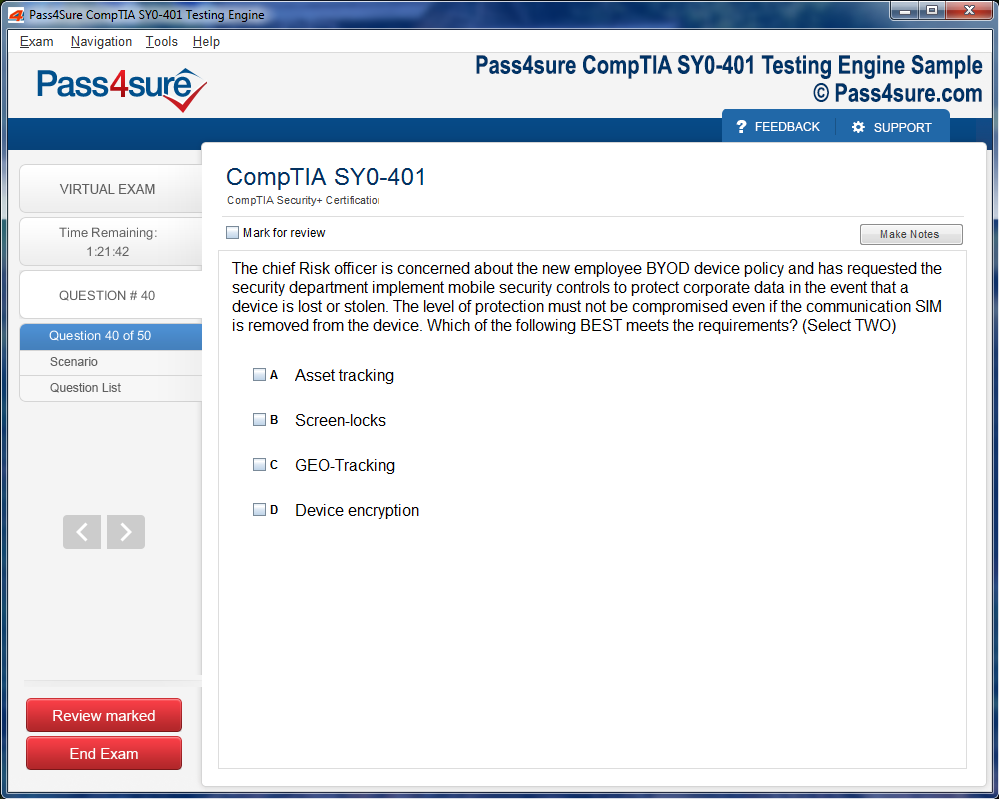
Product Screenshots


Frequently Asked Questions
How does your testing engine works?
Once download and installed on your PC, you can practise test questions, review your questions & answers using two different options 'practice exam' and 'virtual exam'. Virtual Exam - test yourself with exam questions with a time limit, as if you are taking exams in the Prometric or VUE testing centre. Practice exam - review exam questions one by one, see correct answers and explanations.
How can I get the products after purchase?
All products are available for download immediately from your Member's Area. Once you have made the payment, you will be transferred to Member's Area where you can login and download the products you have purchased to your computer.
How long can I use my product? Will it be valid forever?
Pass4sure products have a validity of 90 days from the date of purchase. This means that any updates to the products, including but not limited to new questions, or updates and changes by our editing team, will be automatically downloaded on to computer to make sure that you get latest exam prep materials during those 90 days.
Can I renew my product if when it's expired?
Yes, when the 90 days of your product validity are over, you have the option of renewing your expired products with a 30% discount. This can be done in your Member's Area.
Please note that you will not be able to use the product after it has expired if you don't renew it.
How often are the questions updated?
We always try to provide the latest pool of questions, Updates in the questions depend on the changes in actual pool of questions by different vendors. As soon as we know about the change in the exam question pool we try our best to update the products as fast as possible.
How many computers I can download Pass4sure software on?
You can download the Pass4sure products on the maximum number of 2 (two) computers or devices. If you need to use the software on more than two machines, you can purchase this option separately. Please email sales@pass4sure.com if you need to use more than 5 (five) computers.
What are the system requirements?
Minimum System Requirements:
- Windows XP or newer operating system
- Java Version 8 or newer
- 1+ GHz processor
- 1 GB Ram
- 50 MB available hard disk typically (products may vary)
What operating systems are supported by your Testing Engine software?
Our testing engine is supported by Windows. Andriod and IOS software is currently under development.
Google Cloud LookML Developer Certification: Key Takeaways & Notes
In the contemporary data landscape, the influx of digital information is both immense and continuous. Businesses, governments, and organizations produce data streams at extraordinary rates, and making sense of these streams is crucial for decision-making. Looker has emerged as a pivotal tool in this environment, bridging the divide between raw data and actionable insights. Unlike traditional reporting tools, Looker allows users to interact with data intuitively while maintaining technical rigor in the background. It serves as an abstraction layer, concealing the complexities of SQL queries and database structure from the end-user, while exposing meaningful measures and dimensions for exploration.
At the heart of Looker is LookML, a declarative modeling language designed to map underlying data sources into structured, reusable analytical layers. LookML is unique in that it is not a machine learning framework nor a markup language—it is a bridge between raw data and human interpretation. By defining views, dimensions, measures, and relationships, LookML allows organizations to standardize analytics and prevent inconsistencies across teams. Users can explore data confidently, knowing that a metric defined in one report aligns perfectly with another report built elsewhere in the system.
The importance of Looker goes beyond mere visualization. Standardizing metrics ensures uniform interpretation across departments, making analyses trustworthy and actionable. For instance, defining “monthly active users” once in LookML prevents discrepancies in different dashboards. It transforms data from a chaotic resource into a coherent organizational asset, supporting both operational decisions and long-term strategy.
LookML Architecture and Its Core Components
LookML’s architecture is designed for modularity, clarity, and efficiency. At the foundation are views, which represent tables or logical entities in a database. Each view includes dimensions, which are descriptive attributes, and measures, which are quantitative calculations. By defining these elements once, developers eliminate redundancy and create reusable structures that can power multiple dashboards and analyses.
Explores sit atop views, providing an interface that allows users to query multiple views simultaneously. Through exploration, business analysts can combine datasets, filter results, and uncover insights without directly writing SQL. This abstraction encourages self-service analytics, freeing technical teams from repetitive tasks and enabling users to answer their own questions.
Datagroups and persistent derived tables (PDTs) form another critical layer of the architecture. Datagroups govern caching and refresh strategies, ensuring that queries return accurate results while maintaining performance. PDTs, on the other hand, precompute datasets, reducing computational load on primary databases and accelerating the user experience. Together, these components create a robust, scalable framework for modern analytics, where speed, accuracy, and accessibility coexist harmoniously.
Crafting Efficient Data Models
Creating effective LookML data models requires a combination of technical expertise and strategic foresight. Developers must anticipate how end-users will query data and ensure that views, joins, and measures are optimized for both performance and clarity. A well-constructed data model transforms raw tables into an intuitive, navigable representation of business operations.
Joins are particularly critical in LookML modeling. They allow developers to link views in ways that reflect real-world relationships, such as connecting sales transactions to customer information or product hierarchies. However, joins must be crafted carefully; incorrect cardinality or misaligned relationships can produce inaccurate results. Measures, including sums, averages, and ratios, must align with business logic, while dimensions should provide meaningful segmentation for analysis. Persistent derived tables enhance performance by materializing frequently accessed data, allowing large queries to execute quickly without overloading source systems.
Democratizing Data Across the Organization
One of Looker’s transformative capabilities is its contribution to data democratization. Historically, complex datasets were accessible only to specialized analysts, creating bottlenecks and delaying decision-making. Looker, powered by LookML, opens this barrier, making data understandable and usable across departments.
Users can explore metrics, create visualizations, and generate reports without needing to know SQL. Business teams, marketing managers, operations leads, and executives all gain the ability to interact with data directly. This promotes a culture where insights are shared rather than siloed, improving collaboration and fostering a data-driven mindset. By reducing dependence on specialized technical personnel, organizations can accelerate decision-making and embed analytical thinking into daily operations.
Performance Optimization and Scalability
Performance and scalability are core concerns when working with LookML in enterprise environments. Queries that work well on small datasets may falter under the weight of millions of rows. LookML developers must employ strategies that balance responsiveness with computational efficiency.
Datagroups, caching, and persistent derived tables are essential tools. Datagroups manage refresh schedules for derived data, maintaining accuracy without overloading servers. PDTs materialize heavy computations in advance, providing faster query responses. Moreover, developers must anticipate high-demand dashboards, frequently used filters, and complex joins. Strategic design, thoughtful indexing, and optimized measures ensure that models remain fast and scalable even as data volume grows. Efficiency in LookML is achieved through design elegance rather than brute force, creating models that scale gracefully with organizational needs.
Real-World Applications and Use Cases
Applying LookML effectively requires embedding business context into every model. A sales analysis, for example, might incorporate revenue recognition rules, regional hierarchies, seasonal adjustments, and customer segmentation. Filters, user attributes, and dynamic parameters allow dashboards to adapt to different user needs, providing personalized insights without duplicating models.
Scenario-based practice is invaluable for mastering LookML. Simulated exercises, such as creating dashboards for marketing campaign performance, financial forecasting, or operational monitoring, allow developers to encounter real-world challenges. Syntax nuances, join misconfigurations, and caching conflicts are common hurdles that, once resolved, strengthen proficiency. Iterative problem-solving in a controlled sandbox environment equips developers with the skills to deploy robust, production-ready models with confidence.
Integrating Looker with Cloud Ecosystems
Looker’s integration with cloud services significantly enhances its value. Cloud-native databases and storage solutions provide scalability, parallel processing, and flexible compute resources. This enables LookML models to query large datasets quickly, supporting near-real-time analytics. Cloud integration also facilitates modular development, version control, and collaborative testing, ensuring that models evolve safely over time.
APIs extend this capability further, allowing Looker insights to flow into other systems. Automated workflows can trigger notifications, update dashboards, or feed operational systems dynamically. By embedding LookML into cloud-based infrastructures, organizations transform analytics from static reporting into actionable intelligence, creating a responsive environment where decisions are informed by fresh, reliable data.
Strategies for Continuous LookML Mastery
Mastery of LookML is an ongoing journey. Structured learning, including formal certifications and scenario-based exercises, solidifies foundational knowledge. Active engagement with professional communities exposes developers to diverse modeling approaches and problem-solving techniques.
Documentation literacy is a critical skill. Looker’s reference materials contain detailed explanations of parameters, advanced joins, caching strategies, and PDT configuration that cannot be fully grasped through experimentation alone. Regularly revisiting documentation uncovers new efficiencies and capabilities. Reflective practice, auditing models, and evaluating dashboards for consistency reinforce understanding. By combining curiosity, disciplined practice, and proactive learning, LookML developers evolve into stewards of data, transforming information into strategic assets for the organization.
Embracing LookML as a Future-Ready Skill
The demand for LookML proficiency is growing in tandem with the emphasis on data-driven decision-making. Unlike traditional BI tools, Looker’s flexibility and developer-centric design ensure that skills acquired today remain relevant in the future. Learning LookML equips professionals with the ability to standardize analytics, optimize performance, and empower users across an organization.
Certification paths provide structure, helping learners track progress and demonstrate mastery. Beyond technical knowledge, the process cultivates analytical thinking, problem-solving, and strategic insight. By investing in LookML expertise, individuals position themselves as essential contributors to organizational intelligence, capable of transforming raw data into actionable, scalable, and impactful insights.
Embarking on the LookML Expedition
Starting a journey into LookML can feel like entering an intricate labyrinth of data constructs, abstractions, and rules. For individuals accustomed to SQL queries or conventional visualization tools, LookML introduces a refreshing paradigm. It shifts the focus from merely retrieving information to structuring data in a model that others can explore intuitively. This subtle yet profound shift requires a mindset oriented toward relationships, hierarchies, and modular design. Unlike writing a one-off SQL query, LookML emphasizes reusable constructs, predictable behavior, and logical clarity.
The initial challenge for beginners is often cognitive rather than technical. The terminology, structure, and philosophy of LookML may feel alien at first. Concepts such as “views,” “explores,” and “looks” form a new vocabulary that must be internalized. However, as one practices, the abstract begins to solidify, and patterns emerge. A view becomes more than a table; it becomes a framework for data logic. An explore transforms from a query starting point into a lens through which insights can be visualized effortlessly.
The early days in LookML involve experimentation, small mistakes, and learning from those mistakes. Approaching LookML as a craft encourages patience and diligence. Each small victory—defining a dimension, creating a measure, or successfully joining two tables—provides reinforcement and builds a foundation for tackling more complex challenges.
Understanding Views and Exploring
At the heart of LookML lies the concept of a view, a representation of a table or a logical entity within a database. A view is more than a mere mirror of a table; it is a thoughtfully structured interface that includes dimensions and measures. Dimensions capture attributes or descriptors such as product names, timestamps, geographical regions, or categories. Measures, in contrast, quantify information—summing revenue, counting transactions, calculating averages, or evaluating ratios.
For example, consider a sales table. Converting it into a view involves defining dimensions like product name, customer location, sales date, and order type. Measures in the same view might include total sales revenue, average order value, quantity sold, and percentage growth over time. This approach allows analysts to dissect the data in a structured, coherent manner, enabling the same view to be reused in multiple scenarios without redundancy. Explorers are the counterpart to views, providing a navigable interface for querying data. They allow analysts to combine multiple views via joins, uncovering relationships across datasets without writing SQL manually. Think of an explore as a map: you start at a known location—a primary view—and traverse connections to discover other related views. This separation between modeling and exploration is central to Looker’s philosophy. Users can interact with data intuitively while developers maintain a clean, maintainable model.
However, beginners often stumble when constructing explores. Joins require an understanding of cardinality and the direction of relationships. A one-to-many join differs significantly from a many-to-many join in terms of result sets and performance. Learning to anticipate how these joins influence aggregations and filtering is key to avoiding errors that may produce misleading insights.
Navigating Common Beginner Challenges
The initial stages of learning LookML are peppered with recurring obstacles. Terminology can be a primary source of confusion. Words like “look,” “explore,” “view,” and “datagroup” carry meanings distinct from traditional data analysis tools. For instance, a “look” is a saved query within Looker, not a chart or report, and an explore is not an analysis output but a query interface. Misunderstanding these terms often leads to frustration, as beginners attempt to map familiar concepts onto new constructs.
Parameter nuances present another challenge. LookML uses subtle syntax variations that depend on context. Time-based splits employ timeframes, whereas duration-based splits use intervals. Failing to distinguish these differences results in errors that may not be immediately obvious. Beginners often spend hours debugging a seemingly minor misalignment of syntax, unaware that the parameter type itself is the root cause.
Code formatting also matters. LookML is forgiving in terms of whitespace, but inconsistent formatting makes debugging difficult. Misaligned blocks, incorrect indentation, or improper use of curly braces can obscure the logic of a model. Maintaining clean, readable code is not merely aesthetic—it ensures that both you and your teammates can understand and extend models effectively.
Beyond these technical hurdles, there is a cognitive challenge. LookML demands simultaneous attention to logic, relationships, user experience, and performance optimization. Beginners may feel overwhelmed when learning to balance all these aspects, but adopting structured strategies helps alleviate cognitive load and fosters mastery.
Effective Learning Strategies
Learning LookML effectively requires intentional practice and structured approaches. Hands-on sandbox environments are invaluable for beginners. These sandboxes provide a risk-free space to experiment with views, explores, joins, and filters. For example, creating multiple views and linking them through explores allows learners to visualize relationships in real time. This experimentation builds intuition, reinforcing theoretical knowledge through practical application.
Structured courses, whether instructor-led or online, accelerate comprehension. Experienced trainers provide not only technical guidance but also insight into best practices, debugging techniques, and optimization strategies. They can highlight common pitfalls and demonstrate solutions that might take beginners weeks to discover independently.
Documentation and community engagement are equally vital. Looker’s official documentation offers detailed explanations of syntax, parameters, and recommended practices. Community forums provide real-world examples, creative problem-solving approaches, and peer-to-peer support. Beginners benefit immensely from reading how experienced developers tackle scenarios, interpret data, and structure reusable models.
Scenario-based exercises provide context and relevance. For instance, constructing a dashboard to analyze sales performance across regions teaches learners to define dimensions and measures, implement filters, create joins, and apply conditional logic. These exercises simulate real-world workflows, helping learners internalize best practices while producing tangible outputs.
Additionally, reflective practice strengthens retention. After completing a project, reviewing each step—why a join was chosen, how a measure was defined, and how a filter impacts results—solidifies understanding and highlights areas for improvement. Iterative refinement fosters both technical skill and conceptual clarity.
First Projects to Build Confidence
Engaging in practical projects is essential for building confidence and reinforcing foundational knowledge. A beginner-friendly project could involve creating a sales performance dashboard. Start by defining a view for the sales table, including key dimensions like product, region, and date, along with measures such as revenue and quantity sold.
Next, construct an exploration that joins the sales table with related entities, such as products and customers. This step introduces the concept of relationships and cardinality concretely. Adding filters for date ranges, regions, or product categories enhances user experience and demonstrates how LookML enables interactive exploration.
Saving queries as looks and compiling them into a cohesive dashboard illustrates the end-to-end workflow. Learners witness how individual components—views, explores, measures, and filters—combine to create a usable analytical interface. This practical exposure transforms abstract knowledge into tangible skill, empowering beginners to tackle more sophisticated tasks.
Completing these initial projects also encourages problem-solving and experimentation. Learners learn to anticipate issues, iterate on solutions, and develop resilience when encountering errors. Each success, however small, builds confidence and fosters a mindset oriented toward growth and curiosity.
Preparing for Certification
Even at the beginner stage, keeping certification in mind helps focus learning. LookML certification tests comprehension of core constructs, best practices, debugging techniques, and optimization strategies. Preparing for certification encourages learners to engage with real datasets, analyze case studies, and complete scenario-based exercises that simulate exam conditions.
Certification preparation emphasizes both theory and application. It requires understanding how views and explores function, how joins affect aggregations, and how parameters influence behavior. It also reinforces best practices, such as code readability, modularity, and maintainability. By practicing within a structured framework, learners develop confidence and proficiency.
Simulating exam-like scenarios—such as debugging an incorrect measure, restructuring an inefficient explore, or creating a derived table for specific business requirements—prepares learners for the types of challenges they will encounter in certification. This structured approach not only enhances technical skill but also cultivates problem-solving strategies applicable to real-world projects.
Certification, while optional, provides a tangible milestone for learners, marking their progress and validating their expertise. It encourages disciplined learning and reinforces the importance of both conceptual understanding and practical implementation.
Advancing to Complex Models
After mastering foundational concepts, learners can advance to constructing complex data models. Derived tables, incremental calculations, and sophisticated joins allow analysts to address intricate business requirements. Advanced modeling requires a delicate balance of efficiency, clarity, and performance optimization. Improperly designed joins or poorly structured derived tables can degrade query performance, producing slow dashboards or incorrect results.
At this stage, parameterization and templating become valuable tools. Dynamic filters, reusable logic, and modular code enhance scalability and flexibility. Learners develop techniques for creating maintainable models that accommodate changing business needs, seasonal datasets, and evolving analytical requirements.
Practicing these advanced skills transforms a LookML user from a beginner into a proficient analyst capable of delivering actionable insights. Understanding complex relationships, structuring models for exploration, and optimizing performance empowers teams to leverage data strategically.
Beyond technical mastery, advanced modeling fosters analytical thinking. Learners learn to anticipate user needs, structure models to simplify exploration, and design dashboards that tell coherent stories. The result is not merely functional analysis but a data ecosystem that supports decision-making, efficiency, and clarity.
Practical Tips for Long-Term Mastery
Sustaining expertise in LookML requires ongoing practice and engagement. Establishing a routine of regular sandbox experimentation, revisiting previous projects, and exploring new datasets strengthens retention and adaptability. Reviewing others’ work, studying community solutions, and analyzing case studies provide continuous learning opportunities.
Mentorship and collaboration further accelerate growth. Working alongside experienced developers, receiving feedback, and participating in peer reviews expose learners to alternative approaches, optimization techniques, and efficient workflows. This collaborative learning fosters both technical skill and strategic thinking.
Documenting workflows and maintaining organized, readable code ensures long-term maintainability. Well-documented models facilitate onboarding for new team members, simplify debugging, and enable consistent application of best practices. It also fosters a sense of professionalism and accountability.
Finally, cultivating curiosity and a growth mindset is essential. Exploring advanced features, experimenting with new modeling techniques, and challenging oneself with complex scenarios ensure continuous improvement and sustained engagement. LookML mastery is a journey, not a destination, and consistent, deliberate practice is the key to success.
The Art of Advanced Views and Measures
Data modeling in LookML is more than just a technical task; it is an exercise in precision and creativity. When you move beyond basic measures and dimensions, you enter a realm where every calculation has meaning and purpose. While simple measures can provide counts, sums, or averages, advanced measures allow you to derive insights that reveal the heartbeat of business operations. For instance, conditional measures can be used to track performance only under specific scenarios, such as counting customers who purchased more than once in a month or calculating revenue generated by returning clients.
Cumulative totals offer another layer of depth, enabling analysts to see growth trends over time. A cumulative monthly sales measure, for example, not only reveals the total sales for each month but also shows how those totals build upon previous periods, highlighting patterns that may otherwise remain invisible. Creating such measures requires a careful understanding of table relationships, the logic of joins, and how to structure derived calculations accurately.
Dimension groups also enhance the flexibility of advanced modeling. By grouping related temporal fields, such as created_date, developers can generate multiple timeframes from a single field—daily, weekly, monthly, quarterly, or even yearly. These fields allow analysts to examine trends in granular detail or view high-level patterns over extended periods. Understanding the nuances between duration-based calculations and standard time splits is critical, as using the wrong approach can distort trends or lead to incorrect conclusions.
Beyond time-based analysis, advanced measures may incorporate ratios, percentages, or weighted metrics that give greater clarity to key performance indicators. For example, calculating the ratio of active customers to total customers over a specific timeframe can highlight engagement levels and business health. Similarly, combining multiple dimensions and measures in conditional logic can surface complex patterns, such as regional performance adjusted for seasonal fluctuations. This level of sophistication allows organizations to make decisions based on a nuanced understanding of their data, rather than relying on simple totals or averages alone.
Explores and Joins: Navigating Data Landscapes
Explorers are the gateways through which users engage with data without needing to write SQL. They transform complex relational structures into intuitive pathways, enabling non-technical users to answer questions and explore relationships freely. However, creating a functional explore requires careful attention to the relationships between tables and the types of joins employed. Choosing between left, inner, or full joins determines not only the completeness of the dataset but also the integrity of results and the efficiency of queries.
A left join, for instance, ensures that all primary records are included even if corresponding secondary records are missing. This is useful when you want to preserve all sales records, while some customers may not have associated demographic information. In contrast, an inner join filters data to only include matching records across tables, which may be essential for precise reporting when incomplete data could lead to misleading outcomes. Full joins, though less common, provide a complete set of records from both tables, filling gaps with nulls where necessary.
Joins, however, can introduce challenges. Fan-out issues occur when the join multiplies rows, creating unexpected inflation of results and placing a heavy load on the database. Managing these issues requires careful design, often using techniques like symmetric aggregates or strategically applied filters to maintain both performance and accuracy. Symmetric aggregates allow the model to perform aggregation before joining, reducing the risk of row multiplication and ensuring that calculations remain meaningful.
Moreover, well-designed explorations provide more than access—they tell a story. By thoughtfully combining joins, dimensions, and measures, developers can guide users through a coherent narrative embedded in the data. Analysts can navigate seamlessly from high-level metrics to detailed records, uncovering patterns and correlations without needing to understand the underlying SQL. This makes data exploration an intuitive, almost visual experience where insights can be discovered naturally.
Persistent Derived Tables and Efficiency Enhancement
Persistent Derived Tables (PDTs) are one of the most powerful tools in LookML for managing performance and scalability. A PDT is essentially a materialized version of a query, stored in the database for repeated use. This is particularly useful when dealing with resource-intensive calculations or aggregations that are frequently queried. Without PDTs, complex queries could slow down dashboards or hinder exploratory analysis, especially with large datasets.
Choosing between SQL-based derived tables and native derived tables depends on the structure of the data and the database technology in use. SQL-based tables allow developers to leverage the full capabilities of SQL for intricate transformations, filtering, or pre-aggregation. Native derived tables, on the other hand, utilize Looker’s internal engine to simplify table creation and maintenance, allowing developers to focus on analytical logic rather than SQL syntax. Both approaches provide significant performance benefits when used strategically.
Complementing PDTs are datagroups, which control caching and refresh behavior. Datagroups define how often a PDT should be regenerated, ensuring that frequently accessed data remains current without overloading the system. By implementing thoughtful caching strategies, developers can reduce redundant calculations, decrease query time, and provide a smoother experience for end users. Understanding when to implement PDTs, how to configure datagroups, and when to allow data to refresh automatically is key to building scalable LookML models that meet real-world demands.
PDTs are particularly effective for aggregations that span multiple tables or involve historical trends. For instance, calculating a rolling 12-month revenue measure or tracking cumulative customer activity over several years can be resource-intensive if performed in real time. Precomputing these results with PDTs ensures rapid access while maintaining accuracy, enabling organizations to respond quickly to evolving business conditions.
Debugging and Validation: Ensuring Reliable Models
Even experienced developers encounter errors when building LookML models. Debugging and validation are essential practices to ensure that models are accurate, reliable, and maintainable. Looker’s Content Validator is an invaluable tool, capable of identifying missing references, syntax errors, and structural inconsistencies. Running validation systematically prevents small mistakes from propagating and becoming larger analytical issues.
The context of errors is critical to understand. Some errors may appear trivial—a misspelled dimension name or a misaligned join—but can have cascading effects on calculations and user experience. Others may reveal deeper conceptual issues, such as misunderstandings about table relationships, primary key uniqueness, or the implications of join types. By carefully examining error messages and tracing their origins, developers can correct root causes and strengthen the overall integrity of the model.
Validation extends beyond syntax checks. It involves reviewing join configurations, ensuring that primary keys are correctly defined, and verifying that measures and dimensions produce expected results. Testing complex calculations against known benchmarks or historical datasets helps identify discrepancies before dashboards reach end users. This iterative process of testing, validation, and refinement is critical to creating models that stakeholders can trust.
Debugging is also a learning process. Each error provides insight into LookML behavior, encouraging developers to adopt best practices and anticipate potential pitfalls. By cultivating a culture of meticulous validation and thoughtful testing, development teams produce models that are resilient, scalable, and precise.
Modular Design and Code Reuse
Modularity is a hallmark of robust LookML development. By breaking models into separate files and importing them where needed, developers can create a flexible, maintainable structure that scales with business complexity. For instance, sales, product, and customer views can each reside in dedicated files, imported into a central explore model as needed. This approach not only organizes code logically but also reduces redundancy and simplifies maintenance.
Updating modular models is far easier than monolithic designs. If a column name changes in the database, modifying it in the source view automatically propagates across all dependent explores, ensuring consistency and avoiding error-prone manual adjustments. This efficiency becomes increasingly important in large organizations where models may have hundreds of interdependent components.
Modular design also supports collaboration. Multiple developers can work on separate files simultaneously without interfering with each other’s work, accelerating development cycles and fostering teamwork. Clear naming conventions, logical file organization, and consistent structure make it easier to onboard new developers and maintain long-term model integrity.
Beyond practical benefits, modularity encourages best practices in analytical design. By isolating logic, developers can focus on specific areas—such as customer behavior or sales performance—without being distracted by unrelated code. This clarity improves both the quality of the model and the speed of iteration, making LookML development more efficient and more effective.
Time-Based Analysis and Dimension Groups
Temporal analysis is central to understanding trends, forecasting future behavior, and evaluating business performance over time. Dimension groups enable this by organizing time-based fields into structured categories such as daily, weekly, monthly, quarterly, and yearly. This allows developers to create consistent and reusable temporal metrics that support a wide range of analytical use cases.
Time-based measures can reveal subtle patterns that are otherwise invisible. Daily fluctuations, weekly cycles, and seasonal trends can all be analyzed through well-structured dimension groups. For example, tracking customer purchases over time with a daily dimension can reveal micro-trends, while a monthly or quarterly dimension provides a broader perspective for strategic planning. Dimension groups also simplify calculations like moving averages, cumulative totals, or period-over-period comparisons, reducing complexity and increasing reliability.
Implementing dimension groups requires careful consideration of the business context. Fiscal calendars, holidays, and time zones may all influence how dates should be interpreted. Misalignment between data and business logic can lead to incorrect metrics, making attention to detail crucial. When configured properly, dimension groups allow analysts to slice and dice temporal data with precision, uncovering insights that drive informed decisions.
Optimizing Queries for Real-World Performance
Even the most elegant LookML models can falter if queries are inefficient. Query optimization is essential to ensure fast, reliable performance for dashboards, explores, and reports. Developers must balance complexity with speed, considering the impact of joins, derived tables, and caching strategies.
Aggregated tables and PDTs play a key role in optimization by precomputing frequently accessed results, reducing query execution time. Strategic use of filters and selective joins further enhances performance, preventing unnecessary data from being processed. Monitoring query performance and identifying bottlenecks allows developers to refine models iteratively, creating a seamless experience for users.
Query optimization is not solely technical; it also improves user experience. Efficient queries return results quickly, supporting dynamic exploration and real-time decision-making. Slow queries frustrate users, hinder adoption, and reduce confidence in the data. By prioritizing optimization alongside accuracy, developers create models that are both performant and actionable.
The Art of Digital Ecosystem Mastery
In the modern era of technology, the concept of a digital ecosystem has emerged as a transformative paradigm. A digital ecosystem is an interconnected network of applications, platforms, and data flows that interact dynamically to produce tangible value, streamline operations, and drive insightful decision-making. Unlike traditional systems, these ecosystems are not static; they are ever-evolving, responding to changes in user behavior, market conditions, and technological innovation.
Understanding the digital ecosystem requires both a macro and a micro perspective. On the macro level, trends such as cloud computing, artificial intelligence, and platform integration define the overarching framework. On the micro level, the subtle interplay of APIs, databases, user interfaces, and workflow engines shapes the daily efficiency and performance of the system. Mastery of this environment demands foresight, analytical precision, and an ability to adapt rapidly to emerging challenges.
Every action within a digital ecosystem generates data. Interpreting this data accurately transforms raw information into strategic insight. Organizations that develop proficiency in this domain can anticipate trends, optimize resources, and unlock hidden opportunities. The key is understanding both the relationships between system components and the patterns in user behavior, which collectively form the pulse of the digital ecosystem.
Furthermore, a well-orchestrated ecosystem facilitates collaboration across departments, integrates diverse workflows, and ensures that information flows seamlessly between stakeholders. By establishing efficient protocols and monitoring mechanisms, organizations can cultivate a robust digital infrastructure capable of supporting both current operations and future expansion. The ability to harness the power of a digital ecosystem is no longer optional; it is a core competency for survival and growth in the digital age.
Architecting Scalable Frameworks
Scalability is the foundation of effective digital infrastructure. Designing systems that accommodate growth without compromising performance requires a blend of engineering rigor and strategic foresight. Scalable frameworks anticipate both current requirements and future demands, ensuring that infrastructure remains resilient under increasing workloads.
One essential principle in scalable design is modularization. By dividing complex functionalities into discrete, independent modules, organizations can manage system complexity more effectively. Each module can be developed, tested, and deployed independently, reducing the risk of cascading failures and simplifying maintenance. Modular architecture also enables parallel development, allowing teams to innovate simultaneously without disrupting existing operations.
Microservices architecture complements modularity by decoupling services into autonomous components that communicate through well-defined interfaces. This approach not only enhances system resilience but also allows individual components to scale independently according to demand. Such flexibility ensures that high-traffic services can expand seamlessly, while lower-demand services maintain resource efficiency.
Load distribution is another critical factor. Even the most robust systems can falter under uneven load or unanticipated spikes in demand. Techniques such as horizontal scaling, automated load balancing, and distributed databases ensure that resources are allocated optimally, maintaining responsiveness and minimizing latency. Implementing caching mechanisms and pre-aggregation further enhances performance, reducing repeated computation and improving user experience.
Effective scalability also relies on rigorous performance forecasting. By simulating high-demand scenarios and stress-testing components, organizations can identify potential bottlenecks and implement preemptive optimizations. Predictive modeling, coupled with historical usage analysis, provides the insights necessary to design systems that remain performant and resilient as operational demands evolve.
Enhancing Operational Agility
Operational agility is the capacity to adapt quickly and efficiently to changing circumstances. In the digital realm, agility encompasses more than rapid response; it involves adaptability, resilience, and the ability to reconfigure processes with minimal disruption. Agility is anticipatory, grounded in continuous monitoring, analysis, and iterative improvement.
Process automation is a cornerstone of operational agility. Automating repetitive and time-consuming tasks not only accelerates workflows but also reduces the likelihood of human error. Robotic process automation (RPA), intelligent workflow engines, and adaptive scheduling systems enable teams to focus on strategic initiatives while routine operations progress seamlessly. Automation ensures consistency, reduces operational friction, and allows organizations to respond rapidly to evolving priorities.
Real-time monitoring enhances agility by providing instantaneous visibility into system performance and operational status. Dashboards, alerts, and predictive analytics allow organizations to detect anomalies, predict bottlenecks, and respond proactively. This level of situational awareness ensures that challenges are addressed before they escalate, safeguarding operational continuity.
A culture of continuous improvement complements technological solutions. Agile organizations encourage experimentation, iterative development, and feedback-driven refinement. Teams are empowered to pivot strategies, adopt new methodologies, and integrate emerging technologies without bureaucratic constraints. This combination of culture and technology fosters resilience, enabling organizations to thrive in volatile and competitive environments.
Operational agility also benefits from scenario planning and contingency protocols. By simulating potential disruptions and establishing predefined response strategies, organizations can reduce downtime, maintain service quality, and optimize resource allocation. Ultimately, agility is not merely a technical attribute; it is an organizational mindset that permeates strategy, culture, and execution.
Advanced Data Orchestration
Data orchestration is the strategic management of information flows, transforming raw inputs into structured insights and delivering them to stakeholders efficiently. In an era where data is abundant, mastering orchestration is essential for operational effectiveness, decision-making, and strategic foresight.
Harmonizing diverse data sources is a central challenge in orchestration. Organizations often rely on a mixture of structured databases, unstructured content, streaming data, and external APIs. Integrating these heterogeneous inputs requires intelligent mapping, transformation pipelines, and standardization protocols. Without careful alignment, decision-makers risk acting on incomplete or inconsistent information.
Automation and scheduling are essential for timely orchestration. Automated pipelines reduce latency, ensuring that insights are available when needed. Scheduled data refreshes maintain the accuracy and relevance of analytical outputs. Additionally, error detection and redundancy mechanisms preserve data integrity, allowing operations to continue smoothly even when disruptions occur.
Data governance plays a critical role in orchestration. Validation checks, lineage tracking, and compliance enforcement guarantee that data remains accurate, secure, and auditable throughout its lifecycle. Effective governance not only mitigates risk but also builds trust in data-driven decision-making, ensuring that insights are actionable and reliable.
Advanced data orchestration also facilitates strategic agility. By connecting disparate datasets, organizations can uncover hidden correlations, predict emerging trends, and identify opportunities that might otherwise remain obscured. Orchestrated data systems become the backbone of innovation, enabling both tactical and strategic initiatives to flourish.
Optimizing System Performance
System performance underpins the effectiveness of digital operations. High-performing systems enhance user experience, accelerate transaction processing, and maximize resource efficiency. Performance optimization is an iterative discipline, combining precise measurement, analytical rigor, and targeted improvements.
Resource allocation optimization is a fundamental technique for enhancing performance. Dynamic provisioning ensures that computational resources—such as memory, CPU, and network bandwidth—scale in response to workload fluctuations. Cloud-native architectures, with their elasticity and automation capabilities, enable systems to expand and contract resources seamlessly, avoiding both underutilization and overload.
Query and process optimization addresses efficiency at the operational level. Inefficient queries or poorly structured workflows can become major bottlenecks. Techniques like indexing, caching, query rewriting, and pre-aggregation reduce execution time and improve system responsiveness. Continuous profiling and benchmarking identify areas for improvement, guiding data-driven optimization strategies.
Load balancing and concurrency management further enhance performance. Distributing workloads intelligently across multiple nodes or processes prevents overburdening individual components. Asynchronous processing, parallel execution, and task prioritization increase throughput and responsiveness, particularly in high-volume environments.
Continuous monitoring is essential for sustaining performance. By tracking metrics such as response time, throughput, and resource utilization, organizations can detect degradation early and implement corrective actions promptly. Performance optimization is a perpetual process, requiring vigilance, adaptation, and continuous refinement. Organizations that prioritize this discipline gain both operational efficiency and user satisfaction.
Resilient Security Architecture
Security is integral to every aspect of digital systems. Resilient security architecture safeguards data integrity, confidentiality, and availability, ensuring that systems remain operational under diverse threat conditions. Security is proactive, adaptive, and embedded into system design from inception rather than as an afterthought.
Layered defense strategies enhance resilience. Combining firewalls, intrusion detection systems, encryption protocols, and access controls creates redundancy and reduces vulnerability. Each layer acts as a barrier, ensuring that breaches are contained and mitigated. Security measures should be commensurate with risk exposure, balancing protection with operational efficiency.
Identity and access management are central to secure architecture. Fine-grained control over permissions ensures that users can access only the resources necessary for their roles. Multi-factor authentication, role-based permissions, and continuous monitoring reduce the risk of unauthorized access and insider threats.
Anticipating evolving threats is crucial. Continuous vulnerability scanning, threat modeling, and penetration testing expose weaknesses before they are exploited. Adaptive security protocols and automated response mechanisms enable real-time threat mitigation. Organizations that integrate resilient security architecture build trust among stakeholders, protect critical assets, and maintain operational continuity even under adverse conditions.
Fostering Innovation Through Analytics
Analytics is the bridge between raw data and actionable insight. By uncovering patterns, trends, and correlations, analytics empowers organizations to innovate, optimize processes, and seize emerging opportunities. Strategic use of analytics transforms operational data into a catalyst for growth and creativity.
Predictive analytics provides foresight. Machine learning models, statistical simulations, and scenario analysis allow organizations to anticipate outcomes and make proactive decisions. This forward-looking approach helps identify opportunities, mitigate risks, and refine strategy before challenges manifest.
Democratization of analytics ensures that insights are accessible throughout the organization. Intuitive dashboards, visualizations, and reporting tools empower teams to interpret data independently. This decentralized approach accelerates decision-making, fosters cross-functional collaboration, and drives experimentation.
Embedding feedback loops in analytics enhances learning. Insights inform adjustments in strategy, processes, and system design, creating a cycle of continuous improvement. Organizations that integrate analytics deeply into operations harness the full potential of data, transforming information into innovation and insight into impact.
The Intricacies of LookML Development
LookML development is a specialized discipline within the realm of data analytics, where clarity, precision, and foresight converge to transform raw data into actionable insights. Unlike generic database querying, LookML operates as a modeling language that structures data into reusable, maintainable, and scalable components. Each model created within Looker serves as a bridge, translating complex relational datasets into intuitive analytical experiences for decision-makers. The core of LookML lies in its ability to abstract complicated SQL logic into modular, comprehensible constructs that can be reused across multiple dashboards and reports.
Understanding LookML begins with its foundational components: views, explores, joins, and derived tables. Views define the structure of individual database tables and establish dimensions, measures, and filters. They explore and act as interactive canvases, allowing users to combine multiple views seamlessly to extract insights without writing repetitive queries. Joins connect views, enabling comprehensive analysis across multiple datasets, while derived tables and persistent derived tables (PDTs) precompute complex aggregations to enhance performance. These elements, when orchestrated correctly, produce a system where data analysts can explore information dynamically without compromising speed or accuracy.
Developers entering LookML must cultivate both patience and strategic thinking. Even minor errors in logic can cascade through interconnected datasets, resulting in misleading metrics or broken dashboards. Moreover, developers are expected to foresee future requirements, ensuring that models remain flexible as organizational priorities shift. Beyond mere syntax, LookML development is a practice in architectural foresight, balancing readability, maintainability, and performance. Modular design lies at the heart of this discipline; reusable components reduce redundancy, simplify updates, and foster collaborative development. Teams can work on separate model files without creating conflicts, streamlining workflow, and ensuring consistency across analytical outputs.
The elegance of LookML emerges from its ability to transform otherwise opaque datasets into structured, accessible knowledge. By mastering these concepts, developers not only facilitate data exploration but also empower decision-makers to derive insights efficiently. This combination of technical skill, strategic insight, and architectural foresight defines the role of a proficient LookML developer, bridging the gap between raw data and actionable business intelligence.
Hands-On Practice and Immersive Learning
Immersive learning is essential for mastering LookML, as passive reading or watching tutorials alone cannot replicate the depth of understanding gained through practical experimentation. Sandbox environments provide a safe space for developers to explore LookML constructs, experiment with views, joins, filters, and derived tables, and observe the real-time impact of their changes. Repeated interaction with these elements fosters an intuitive grasp of LookML mechanics, highlighting subtleties in dimension aggregation, filtering logic, and caching behaviors that are otherwise difficult to internalize.
Scenario-based exercises are particularly effective for reinforcing applied understanding. For instance, creating a sales dashboard that aggregates revenue across regions, product lines, or time periods challenges developers to think critically about data relationships and query efficiency. Similarly, implementing user-based access controls in a reporting system simulates real-world security constraints, teaching developers to balance accessibility with governance. Through these exercises, developers gain practical experience in translating analytical requirements into LookML solutions, building confidence and fluency.
Hands-on practice also sharpens debugging skills. LookML models often produce errors due to join misconfigurations, ambiguous measure definitions, or misapplied filters. Encountering these issues in a controlled environment allows developers to develop systematic troubleshooting strategies. Recognizing error patterns, tracing dependency chains, and verifying logic become second nature, ensuring that developers are prepared for both exam scenarios and real-world projects. Over time, consistent practice fosters not only competence but also creativity, enabling developers to devise optimized and elegant solutions for complex analytical challenges.
Moreover, immersive practice encourages performance awareness. Developers learn to anticipate bottlenecks, understand query execution plans, and apply caching strategies effectively. They discover the nuances of derived tables and PDTs, identifying when precomputing metrics enhances dashboard responsiveness without overloading the database. In essence, hands-on engagement transforms LookML from a theoretical framework into a tangible skill set, equipping developers to deliver actionable insights with both speed and accuracy.
Deep Comprehension of Core Concepts
Mastering LookML requires a profound understanding of its core concepts, moving beyond surface-level syntax to appreciate the underlying logic of model design. Views and explores constitute the backbone of LookML, serving as the primary building blocks for analytical workflows. Views define the granularity of data, specifying dimensions, measures, and filters that govern how information is interpreted. Explores act as interactive layers that combine multiple views, enabling dynamic exploration of relationships between datasets without repetitive coding.
Persistent derived tables (PDTs) and dimension groups introduce additional layers of sophistication. PDTs precompute complex aggregations and store results temporarily, enhancing query performance for large datasets. This capability is crucial when dealing with heavy analytical workloads, as it allows dashboards to remain responsive even under substantial data volume. Dimension groups, on the other hand, standardize temporal or categorical attributes, allowing measures to leverage consistent definitions across multiple contexts. Understanding the interplay between these components is critical for designing models that are both efficient and accurate.
Caching strategies and data refresh mechanisms further complicate the landscape. Developers must strike a balance between query performance and data freshness, deciding when to rely on cached results versus real-time computation. This decision-making process requires both technical acumen and practical foresight, as misaligned strategies can result in slow dashboards or outdated metrics. By internalizing these concepts, developers elevate their practice from mechanical coding to strategic design, crafting LookML models that are resilient, maintainable, and aligned with organizational objectives.
In addition, a deep comprehension of joins is indispensable. Joins allow developers to combine datasets with differing structures, supporting multi-dimensional analysis. Correctly configuring join types, handling null values, and optimizing join performance are essential skills that prevent errors and inefficiencies in analytical workflows. The mastery of these core concepts transforms LookML development from a purely technical task into a discipline of analytical craftsmanship, where precision, foresight, and strategic thinking converge.
Scenario-Based Exam Preparation
The LookML Developer certification emphasizes practical problem-solving, reflecting real-world demands rather than abstract knowledge. Exam preparation, therefore, requires a focus on scenario-based questions, where candidates interpret unformatted LookML code and determine the optimal solution for specific analytical outcomes. This approach tests not only technical understanding but also the capacity to apply knowledge under pressure.
Effective preparation strategies include familiarization with common errors, such as misconfigured joins, ambiguous measures, and filter conflicts. Candidates benefit from identifying error patterns, understanding root causes, and practicing corrective measures. Time management is equally important, as exam questions are dense, often requiring careful analysis of multi-layered code. Practicing under timed conditions simulates the exam environment, enhancing both speed and accuracy.
Scenario-based preparation also involves applying knowledge to realistic business contexts. For instance, candidates might be asked to design a dashboard that aggregates monthly sales across multiple regions, applies access restrictions for sensitive data, or optimizes queries for performance. Engaging with these scenarios develops the ability to translate abstract LookML syntax into practical solutions, bridging the gap between certification requirements and real-world application. By repeatedly encountering complex situations, candidates strengthen their problem-solving skills, gain confidence, and cultivate the judgment necessary for high-quality model development.
Additionally, familiarity with documentation and quick-reference materials enhances exam readiness. Understanding parameter syntax, join configurations, and derived table structures allows candidates to work efficiently, minimizing errors under time constraints. This combination of practical experience, error analysis, and strategic documentation positions candidates for success, ensuring that exam performance accurately reflects their competence and applied expertise.
Real-World Applications and Strategic Implementation
Certification demonstrates knowledge, but real-world application solidifies expertise. LookML developers contribute to organizational success by creating dashboards, building modular views, and optimizing performance across complex datasets. Effective models transform raw data into actionable insights, supporting strategic decision-making across marketing, sales, operations, and finance. The impact of these models is often profound, enabling analysts to explore information efficiently, identify patterns, and make data-driven decisions with confidence.
Collaboration is essential in real-world implementation. LookML projects typically involve data engineers, analysts, and business stakeholders, requiring developers to navigate Git workflows, manage version control, and maintain alignment with data governance policies. This collaborative environment encourages knowledge sharing, standardization of best practices, and accountability across teams. Performance optimization further distinguishes proficient developers, as they balance computational efficiency with analytical comprehensiveness. Techniques such as implementing PDTs, optimizing joins, and leveraging caching strategies ensure that dashboards remain responsive even under heavy analytical workloads.
Strategic implementation also involves anticipating future requirements. Developers design models that accommodate evolving business needs, ensuring that dashboards and reports remain relevant over time. This forward-looking approach reduces technical debt, streamlines maintenance, and enhances organizational agility. By transforming complex relational data into intuitive, reusable analytical structures, LookML developers empower stakeholders to derive insights efficiently, bridging the gap between technical capabilities and strategic objectives.
Continuous Learning and Adaptation
LookML development is a dynamic discipline, requiring continuous learning and adaptation to remain effective. Technologies, business requirements, and analytical methodologies evolve, necessitating ongoing engagement with new features, integrations, and best practices. Developers who embrace lifelong learning remain at the forefront of their field, capable of leveraging emerging tools and methodologies to deliver superior analytical outcomes.
Continuous learning involves engaging with documentation, exploring advanced tutorials, and participating in community forums. Exposure to diverse problem-solving approaches enhances adaptability, broadens perspective, and fosters innovative solutions. Integration with cloud platforms, AI-driven analytics, and machine learning pipelines further expands the scope of LookML applications, enabling developers to build predictive models, automate workflows, and extract deeper insights from complex datasets.
Reflecting on past projects is equally important. Continuous improvement involves evaluating model performance, identifying areas for optimization, and iteratively refining structures. Developers cultivate a mindset of strategic foresight, ensuring that their models remain maintainable, scalable, and aligned with organizational objectives. This iterative process not only improves technical proficiency but also reinforces problem-solving skills, critical thinking, and analytical creativity.
Ultimately, continuous learning transforms LookML development into a discipline of intellectual craftsmanship. Developers who combine technical mastery with curiosity, creativity, and strategic vision elevate their practice beyond certification, creating analytical environments that empower decision-makers, enhance organizational efficiency, and drive data-driven growth. By embracing experimentation, hands-on practice, and proactive learning, developers build expertise that transcends technical knowledge, fostering innovation and impact within their organizations.
Conclusion: Mastering LookML for Data-Driven Success
LookML is more than a modeling language—it is a bridge between raw data and actionable insights. Over the course of this series, we’ve explored the fundamentals of Looker, the nuances of LookML, the architecture of views and explores, the intricacies of derived tables and joins, and the strategies for performance optimization and real-world application. We’ve also navigated the challenges that beginners face, from terminology confusion to debugging complex code, and highlighted practical learning strategies to accelerate mastery.
Top Google Exams
- Professional Cloud Architect - Google Cloud Certified - Professional Cloud Architect
- Associate Cloud Engineer - Associate Cloud Engineer
- Generative AI Leader - Generative AI Leader
- Professional Machine Learning Engineer - Professional Machine Learning Engineer
- Professional Data Engineer - Professional Data Engineer on Google Cloud Platform
- Professional Security Operations Engineer - Professional Security Operations Engineer
- Professional Cloud Security Engineer - Professional Cloud Security Engineer
- Cloud Digital Leader - Cloud Digital Leader
- Professional Cloud DevOps Engineer - Professional Cloud DevOps Engineer
- Associate Google Workspace Administrator - Associate Google Workspace Administrator
- Professional Cloud Network Engineer - Professional Cloud Network Engineer
- Professional Cloud Database Engineer - Professional Cloud Database Engineer
- Professional Cloud Developer - Professional Cloud Developer
- Associate Data Practitioner - Google Cloud Certified - Associate Data Practitioner
- Professional Chrome Enterprise Administrator - Professional Chrome Enterprise Administrator
- Professional Google Workspace Administrator - Professional Google Workspace Administrator
- Professional ChromeOS Administrator - Professional ChromeOS Administrator